
Data powers decisions. But only if it can be trusted.
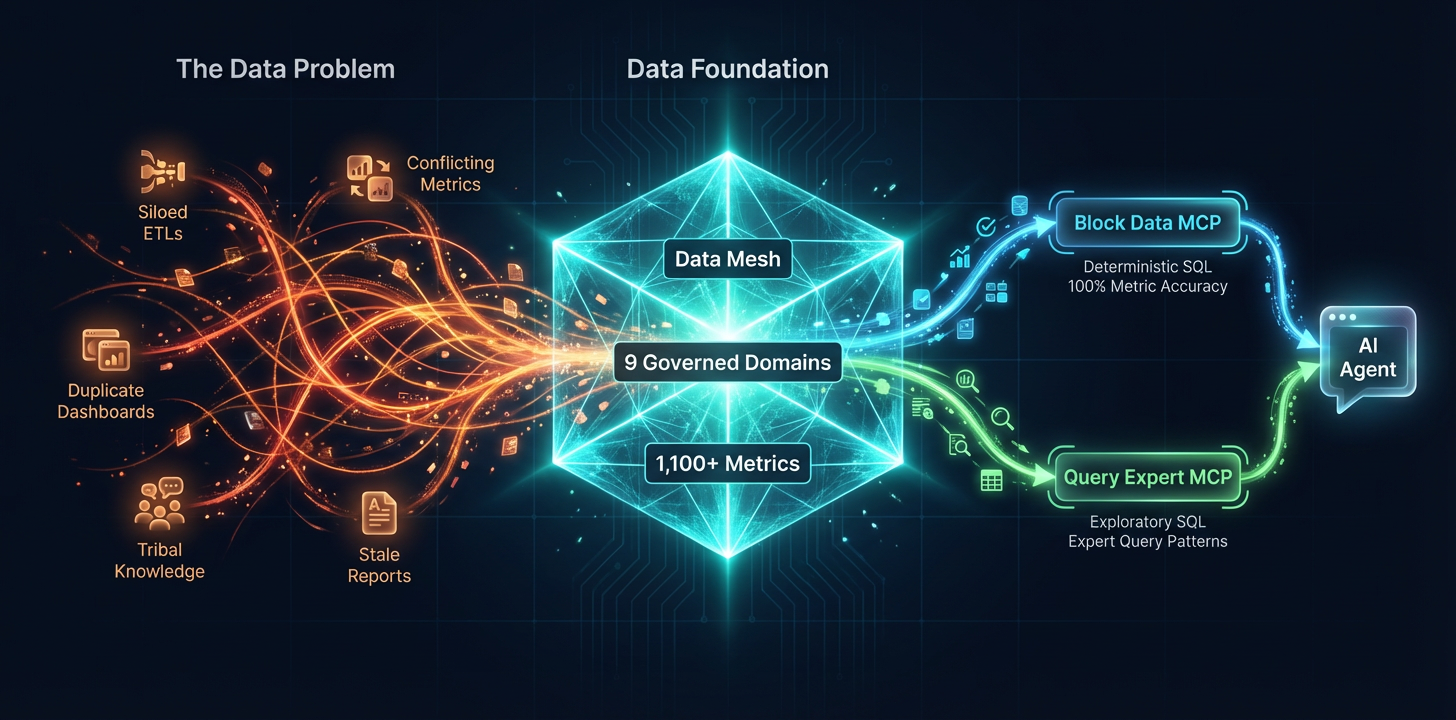
When we looked across Block, we found the same metrics being calculated dozens of different ways, analysts duplicating each other's work without knowing it, and AI agents cheerfully generating SQL that looked right but produced numbers that nobody could trust. We had a tooling problem. But underneath it, we had a data strategy problem.
This is the story of how we overhauled Block's entire relationship with data: governance, ownership, metric definitions, and organizational alignment. We adopted a variation on the data mesh framework, built a governed semantic layer, and created custom MCP servers to orchestrate safe, accurate AI-powered analytics. The result is a system where any data user at Block can go from a business question to a trusted answer through an AI agent, with 100% metric accuracy for governed metrics with no SQL review required, or dynamically generate SQL from verified context sources.
Once that foundation was in place, it unlocked automation. By building pathways for deterministic, governed SQL, we could automate on-call processes, allow leadership to get immediate answers to custom data questions, unblock users from finding the data they need, and enable AI agents contribute new metrics and context through full automation loops.
Here's how we got there and what we learned along the way.
Define the Mission
Before writing any code, we made four key decisions:
First, we anchored on a specific business application. Our end goal was to allow any data user at Block to go from a business question to a trusted answer through an AI agent. But we didn't start by building a general-purpose solution. We started by identifying 40 real business questions that Finance and Sales leadership actually ask on a recurring basis. Questions like "What was Cash App's monthly active user growth last quarter?" or "How does Square GPV compare year over year by region?" A defined question set gave us a finish line we could measure against.
Second, we set an uncompromising success criterion: 100% metric accuracy. Not 95%. Not "close enough for a first pass." When the CFO asks for a number, that number needs to match the source of truth exactly. This single decision forced us down a fundamentally different architectural path than most AI analytics projects, which optimize for flexibility at the expense of precision. We optimized for precision first and layered flexibility alongside it.
Third, we identified that the core problem working with data at Block was how to get started: At large organization at scale, there are hundreds of thousands of data tables, multiple slack channels for data help, and a proliferation of best practices living in google docs, github, slack and people's heads. A data problem is first a cold start problem: where do I go, who can I work with and which table do I need to use? We optimized our context layers to understand our data structure, the data experts, and the ambiguity hidden in the data so that the agent can truly be a first class coworker.
Fourth, we assembled a cross-functional tiger team. The core group was small: a Tech Lead, two Data Engineers, three Data Scientists, and one AI Engineer. This team built a working proof of concept in six weeks. As the project scaled, we brought in partners from Data Governance, Platform Engineering, Product, and Business stakeholders. Cross-functional buy-in turned out to be the single most important factor in scaling the project from a POC to a company-wide platform. Without governance teams at the table, we would have built another silo. Without business stakeholders, we would have optimized for the wrong questions.
What We Tried First (and What We Learned)
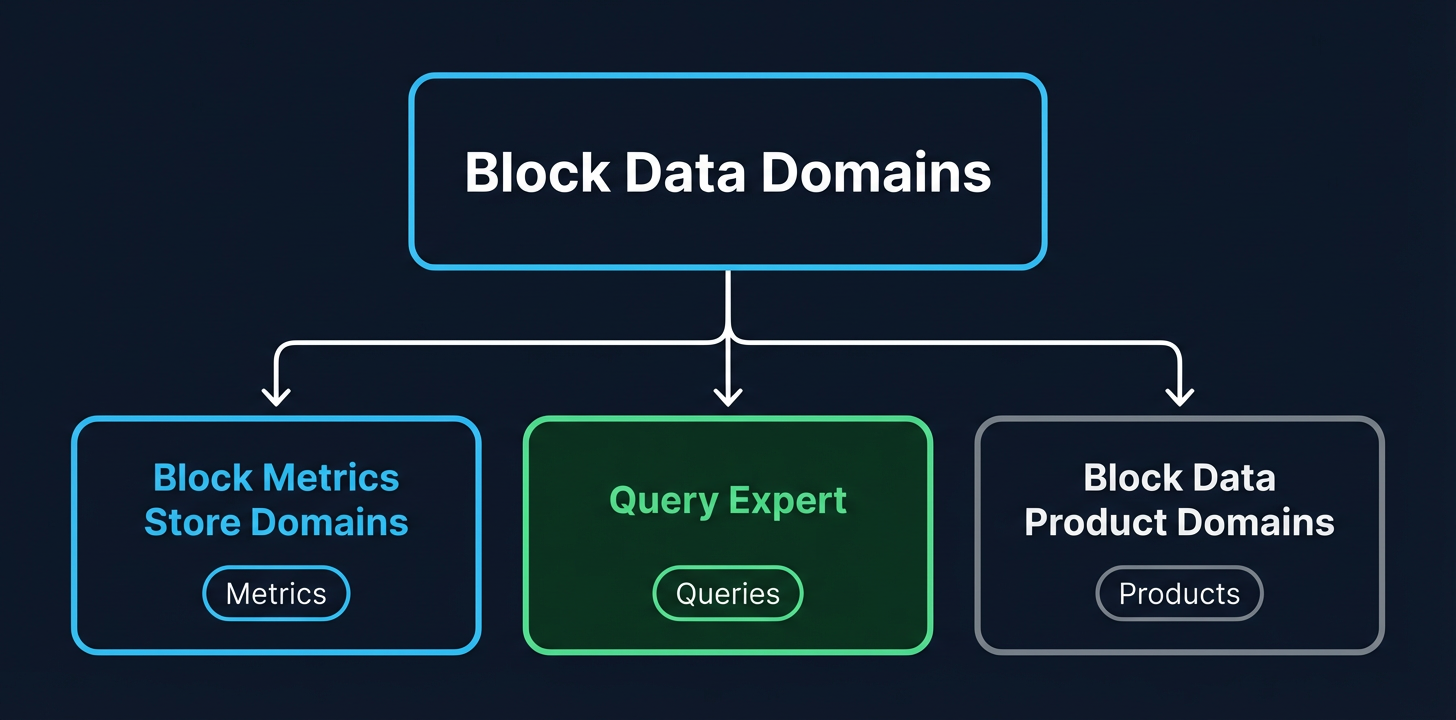
Our first attempt was to build a single MCP server that combined two capabilities: a governed semantic layer (Block Metrics Store) for retrieving pre-defined, validated metrics, and a natural-language-to-SQL engine (Query Expert) for open-ended data exploration. On paper, this made sense. One tool, one interface, one place for users to ask questions. In practice, no one was fully satisfied.
Business users, particularly finance and executive stakeholders, came to the tool expecting precise, trustworthy answers. They wanted to ask "What was the total revenue last quarter?" and get a number they could put in a board deck without second-guessing it. When the system occasionally routed their question through the natural-language SQL path instead of the governed metric path, they got answers that were close but not exact. Close is not good enough when your success criterion is 100% accuracy. Their feedback was clear: "I can't trust this."
Technical users, mostly analysts and data scientists, had the opposite complaint. They came to the tool wanting breadth. The governed semantic layer only covered a subset of available metrics, especially in the early days, and analysts needed to reach beyond what had been defined so far. Their feedback was equally clear: "This isn't flexible enough."
We were trying to serve two fundamentally different user intents through a single interface, and the result was a tool that felt unreliable to one audience and constraining to the other.
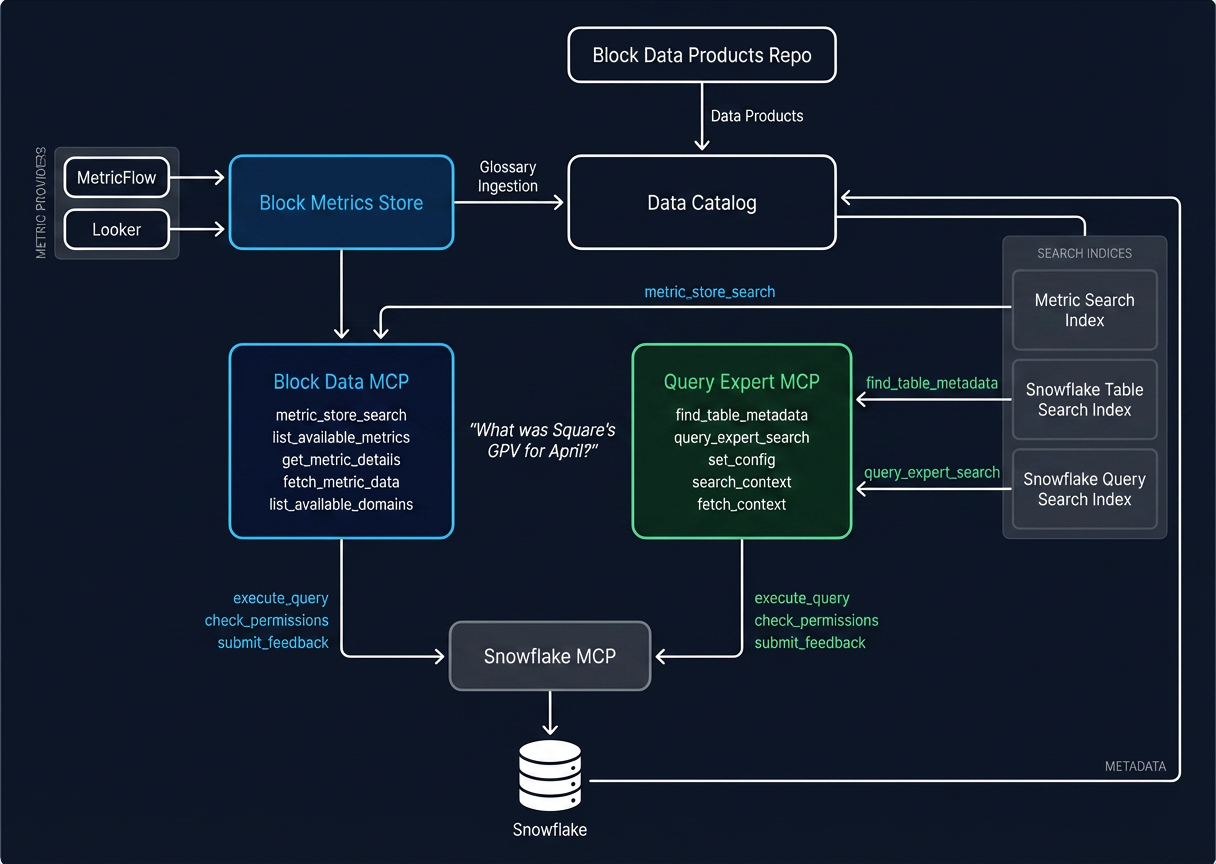
The solution was to separate the concerns entirely. We split the single MCP into two distinct tools:
Block Data MCP, powered by Block Metrics Store, optimized for deterministic accuracy. When a user asks for a metric, the system retrieves pre-approved SQL logic from the semantic layer and runs that SQL without revealing it to the LLM. The LLM cannot edit the executed SQL. The answer is the same every time, regardless of how the question is phrased.
Query Expert MCP, optimized for exploratory flexibility. It curates historical data scientists' query patterns, data context and table schemas in a RAG architecture for the LLM to search, validate, and generate SQL. The results are less deterministic but far more flexible.
This separation gave each user group exactly what they needed. Business users got a tool they could trust unconditionally. Technical users got a tool that met them where they were. And users could switch between either MCP depending on their use case.
The Architecture: Two Tools, One Ecosystem
Once we separated concerns, the architecture crystallized into two distinct MCP servers that serve different user intents while sharing a common data infrastructure.
| Persona | Traditional Usage | AI-Enhanced Usage |
|---|---|---|
| Business Users (e.g., Executive Leadership, Operations) | Relies on analysts for ad-hoc reporting questions. Searches dashboards for business insights. | Asks natural language questions in AI tools to get custom analysis. Automates data consumption workflows. |
| Technical Users (e.g., Data Scientists, Data Engineers, Product Managers, Engineers) | Fields SQL-heavy ad-hoc requests. Navigates data sprawl to search for data sets. | Uses AI tools to automate SQL, providing expertise to validate. Asks AI to identify source of truth tables for business questions, data context, and data experts. |
Block Data MCP: Trusted Metrics for Business Users
The Block Data MCP is designed for a specific audience: business users, product managers, executives, and anyone seeking access to trusted metrics without needing to know SQL. Its core engine is the Block Metrics Store, a governed semantic layer, powered by Metricflow, that serves as the central source of truth for metric definitions across Block. A finance leader asking a question in natural language gets routed through the same governed pipeline as an analyst using the tools directly.
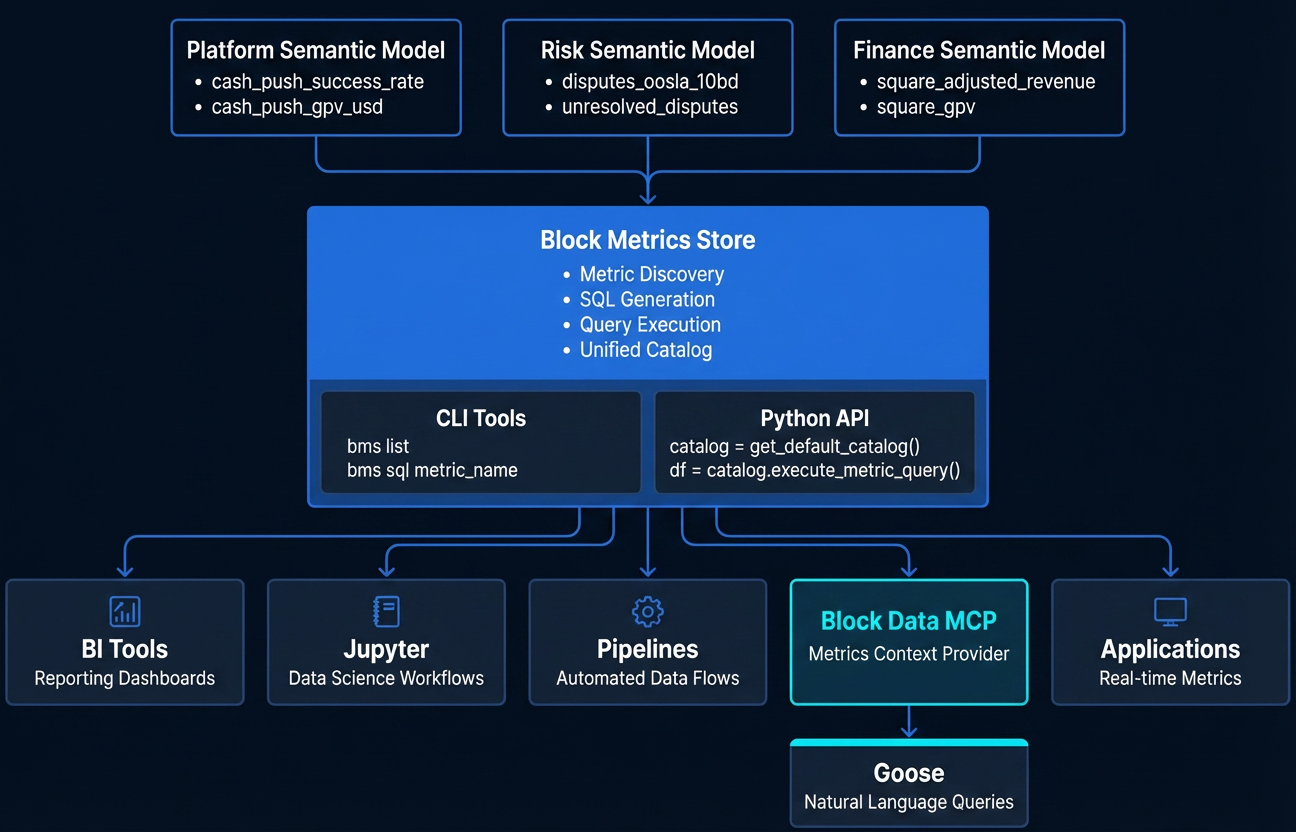
The Block Metrics Store currently contains over 1,100 governed metrics that have been contributed by data stewards across the company. These cover revenue, GPV, active users, retention, and more across all of Block's brands (Square, Cash App, Afterpay, TIDAL, Bitkey). Each metric is defined as code in a centralized GitHub repository. A metric definition includes the SQL logic, dimensional attributes, and a rich set of governance metadata: who owns it (business and technical owners), what governance level it has achieved, which brand it belongs to, what audience tier it serves, and a link to the validation source used to confirm its accuracy. Here is a simplified example:
yaml1metric:
2  name: cash_app_total_inflows_usd
3  label: Total Inflows
4  description: "The total amount of USD from all Inflow transactions..."
5  type: SIMPLE
6  config:
7    meta:
8      business_owner: quantitative-finance
9      technical_owner: cash-bie
10      support_slack_channel: "#money_movement_data"
11      governance_level: verified
12      brand: cash_app
13      audience_tier: tier_1
14      use_case: inflows_framework, earnings
The MCP itself is built as a set of structured tools that an AI agent can call: search for metrics by keyword, retrieve metric details (including governance level, owner, and available dimensions), fetch data with filters and dimensional breakdowns, discover existing dashboards and reports, check user permissions, and submit feedback. The key architectural choice is constraint by design. Rather than giving the AI agent open-ended access to a data warehouse, the MCP acts as a menu of validated operations. All of the MCP tools provide metadata and query results only, thus preventing the LLM from modifying SQL and still claiming the result is validated.
Governance is enforced through a three-tier system:
- Certified: The metric meets the strictest governance requirements. Upstream data sources are reliable, the definition is well-documented and aligned across stakeholders, and it has been approved by both owners and the platform team.
- Verified: The metric has been approved by business and technical owners with submitted validation documentation.
- Preliminary: The metric has passed baseline platform validation (configuration and metadata checks) but has not yet been validated for data accuracy.
This tiered approach lets teams onboard new metrics quickly at the preliminary level without gatekeeping, while making the level of trust around any given metric transparent to consumers. The system tells you not just what the number is, but how much you should trust it.
Query Expert MCP: Exploratory Analysis for Technical Users
Not every question maps to a pre-defined metric. Analysts exploring a new dataset, investigating an anomaly, or building a one-off analysis need the freedom to discover tables, learn from expert query patterns, and write custom SQL. That is the role of Query Expert MCP.
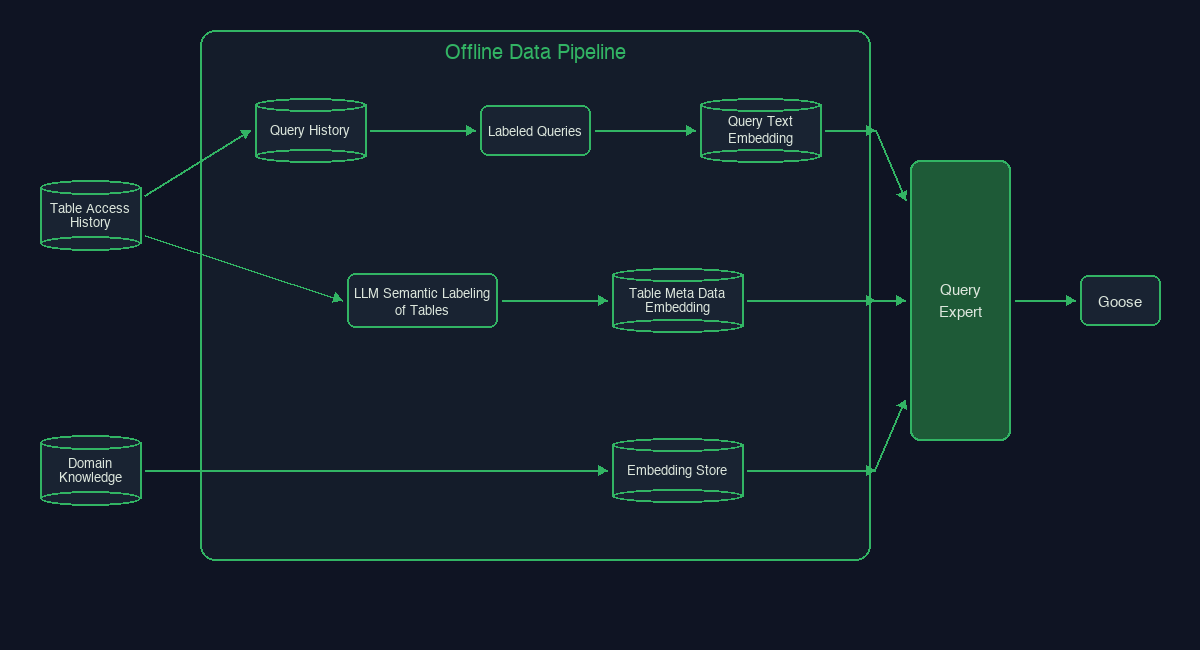
We built Query Expert to have a RAG architecture that mimics a Data Scientist's flow:
- Understand the business and domain data context around a specific question
- Understand the tables that best fit that question
- Mimic similar, example queries based on Analyst's query history
- Validate query generation against human reviewed queries
When a user asks a question, the MCP guides the AI agent through a structured workflow: understand the user's intent, search brand and domain-specific context (glossary, demographics, business rules), search for relevant tables and their metadata (including column schemas, owners, and common join patterns), find historical queries written by the people who know the data best, and then synthesize a query with a full "Query Expert Report" before execution. The report includes the proposed SQL, a list of expert users who write similar queries, and related tables to explore. This allows a human in the loop to verify the SQL and the data experts they could consult with to verify its accuracy.
The results from Query Expert are inherently less deterministic than the Metrics Store. The LLM has more latitude in constructing and adapting queries. But this is a deliberate tradeoff. Query Expert serves a different user intent, and users who reach for it understand they are in exploratory territory rather than pulling governed metrics.
Institutional Data Knowledge at Scale
Query Expert is built on three knowledge sources designed to surface reliable, up-to-date domain context — knowledge that previously lived in Slack channels, docs, or analysts' heads.
Data Knowledge Data teams can create and add data domain specific knowledge that is embedded into a vector database to be semantically retrieved by the agent. Data knowledge ranges from highly specific knowledge stores - like when to include taxes or no taxes in your revenue calculation - to broad stroke common data practices such as connecting common acronyms to data fields and common demographic terms. Knowledge previously spread out or with uneven quality is now centralized to be easily discovered.
Table Knowledge At Block, we have over 100K analytics tables. Often, just finding the right dataset to answer your question is the hardest part of starting your analytics project. To fix this, we found all the highly used tables at Block, which narrowed the number to about 10K and enriched the tables with semantic descriptions based on Slack history, GitHub lineage, docs and sample queries.
yaml1table_name: CASH_APP.ANALYTICS.DIM_CUSTOMERS
2table_type: Analytics
3table_description: >
4  300-500 words describing what this table contains, its data lineage, common business questions answered, common query patterns
5primary_key: CUSTOMER_ID
6column_schema:
7  - CUSTOMER_ID:
8    - data_type: INT
9    - description: The unique identifier of a cash app customer. This is the primary key of the dataset.
10  - SIGNUP_AT:
11    - data_type: TIMESTAMP
12    - description: The timestamp of when the customer signed up for cash app. This is used for cohort analysis and anchoring on when the user first onboarded to Cash App. Often used as the first top of funnel event.
Queries Query Expert derives its name from finding the experts who know how to query the data. We achieve this by taking a random sampling of all Data Scientists' recent query history and build a knowledge corpus around that individual. When anyone asks a data question, the MCP searches over all analyst patterns, then hones in on the most relevant analysts' query history to find the query expert to follow.
Each month over 400M queries are ran at Block. Mining query history - even a guardrailed sample - can contain more noise than signal. This is why we created Labeled Queries that data scientists can load into the vector databases simply by adding a comment to their query. These queries produce high-quality semantic embeddings and are vetted for accuracy to be the ground truth for how to query specific pieces of business knowledge. These queries are handled in a sidecar vector database and are searched on first before falling back to the random sampling of query history. Most useful, these queries validate any LLM generated queries to ensure standard SQL logic is followed, and unlocks reproducibility of text-to-SQL generation.
sql1select date_trunc('month', signup_at::DATE) AS signup_month
2      ,case when signup_source = 'APP' then 'Mobile' else 'Web' end as signup_source
3      , count(distinct customer_id) AS unique_signups
4from cash_app.analytics.dim_customers
5where signup_at::DATE BETWEEN '2025-01-01' and '2025-12-31'
6and is_test_account = FALSE
7and is_risk_flagged = FALSE
8group by 1,2
9/* query_expert: The unique number of cash app signups by month and source. Common segmentation of web vs. mobile by signup_source used by marketing. Always remove test accounts and accounts flagged by risk when counting unique signups. */
10;
Keeping Context Fresh
As the business changes, so does the data. The meaning of a table and the problems it solves can quickly become outdated. We have daily ETLs that update the vector databases based on deterministic changes such as a new column is added to a table, a new table is created, or a table is no longer used. We also have agentic automations that tag highly relevant queries to be labeled and scrape Slack channels for updates to the knowledge store. Investing in these automations ensures the most up to date knowledge is available.
Separate but Synergistic
Some internal users opt to use only Block Data MCP or only Query Expert MCP depending on their role, but many use both. Both MCP servers can be enabled in the same AI agent session. The agent's instructions guide it to check Block Data MCP first for any question that might map to a governed metric, and fall back to Query Expert MCP when the question requires broader exploration. This means a user can start a conversation asking for a trusted revenue metric (routed through Block Data MCP) and follow up with an ad-hoc investigation into the underlying data (routed through Query Expert MCP), all in the same session.
Both tools share the same Snowflake permissions layer (RBAC), ensuring that users only see data they are authorized to access regardless of which path they take. And both feed back into each other: queries validated through Query Expert can inform new metric definitions in the Metrics Store, and gaps surfaced through Block Data MCP usage drive prioritization of new governed metrics.
The Data Strategy Overhaul
None of the architecture described above would have worked without a fundamental restructuring of how Block organizes, governs, and owns its data. This section is about that work. It is less glamorous than building MCP servers, but it is the reason the MCP servers actually produce useful results.
Breaking Down Silos
Prior to this project, Block's data teams often worked in silos. Individual teams maintained their own ETL pipelines, built their own dashboards, and defined their own metrics. The same business concept could have multiple definitions depending on which team you asked. This is a common pattern at large companies, and it is manageable when humans are the only consumers of the data. An experienced analyst knows to ask "which revenue number?" before putting a figure in a deck.
But when you put an AI agent in front of that fragmented landscape, the problem compounds. The agent doesn't know which definition is canonical. It doesn't know which dashboard is stale. It doesn't know that two tables with similar names serve different purposes. Without a coherent data strategy underneath, even the best-engineered MCP server will produce inconsistent answers.
We quickly realized that if we let anyone add metrics to the Metrics Store without a governance framework, we would end up right back where we started: duplicate metrics, conflicting definitions, and no data coherence.
Adopting Data Mesh
To address this, we borrowed concepts from the data mesh framework and organized all of Block's data into a core set of top-level Data Domains: Customer Support, Financial, Internal, Product, Operations, Risk, Marketing, and Sales.
The domain structure follows four core principles:
- Domain Ownership. Product teams organize into logical data domains (even if this doesn't map to existing reporting structures). Each domain has a steering committee responsible for the data produced within that domain.
- Data as a Product. Data domains approach sharing data the way you would approach building a product. Each domain is responsible for the quality of its data, both correctness and usability.
- Self-Serve Platform Infrastructure. Platform teams provide domain-agnostic tooling and frameworks. Golden paths with built-in observability so domain teams can focus on their data, not their infrastructure.
- Federated Computational Governance. Centralized governance committees provide standards and policies. Governance is enforced as code, not as process documents that no one reads.
A key design decision was that domains describe the function of data, not Block's organizational structure. If the company reorganizes, the domains remain stable. A "Financial" domain is always financial data, regardless of which VP it reports to. This was inspired by the DAMA framework with minor adjustments for Block's specific needs.
Governance as a Foundation, Not an Afterthought
With domains established, we needed a governance framework that was strict enough to guarantee metric accuracy but flexible and lightweight enough that teams would actually adopt it. Too heavy and teams would route around the system. Too light and we would lose the trust guarantees that the entire architecture depends on.
The governance framework we built centers on a few key mechanisms:
Metric ownership. Every metric in the Block Metrics Store has a designated business owner (the team responsible for the metric's meaning and accuracy) and a technical owner (the team responsible for the implementation and code logic). This dual ownership ensures that metrics are reviewed from both a business and engineering perspective.
CODEOWNERS. The Metrics Store is a centralized GitHub repository, and metric definitions are governed through standard code review. Changes to metric definitions require approval from the owning team via GitHub CODEOWNERS. This means metric changes go through the same review rigor as production code.
Governance tiers. As described in the architecture section, every metric carries a governance level (Preliminary, Verified, or Certified) that makes its trustworthiness transparent. Teams can onboard metrics quickly at the preliminary level and promote them as validation is completed. This keeps the system accessible without compromising on trust signals.
Audience tiers. Metrics are tagged by their intended audience: Tier 1 (external, shared with investors and regulators), Tier 2 (company-wide reporting), Tier 3 (org-wide), and Tier 4 (exploratory or team-specific). This helps consumers understand the stakes associated with a given metric and ensures that the highest-scrutiny metrics receive the most rigorous validation.
The result is a system where governance is embedded in the data itself, not layered on top as a separate process. When a user queries a metric through the Block Data MCP, the governance metadata travels with the result. They can see who owns it, how it has been validated, and what audience it was designed for. Trust is not assumed; it is demonstrated.
Proving Value: The Finance Copilot
With the architecture and data strategy in place, we needed to prove that the system actually worked in a high-stakes, real-world setting. We chose finance.
The Finance Copilot was our first full-scale pilot. The goal was to transform Block's fragmented financial data ecosystem into a unified AI-powered interface where finance leadership could ask natural language questions and get answers they could trust for board decks, earnings preparation, and executive reporting. The target was zero variance between Finance Copilot metrics and the source of truth.
40 Questions, 100% Accuracy
We started by collecting 40 real business questions that Block's finance and strategy leadership actually asks on a recurring basis. These ranged from straightforward metric lookups to questions requiring dimensional breakdowns, time-range comparisons, and cross-brand analysis. We categorized them by complexity and used them as both a development target and an evaluation framework.
For each question, we worked through a structured process:
- Define the metric. If the question mapped to a metric that didn't yet exist in the Block Metrics Store, we built the semantic model and metric definition, starting at the preliminary governance level.
- Validate against ground truth. Every metric was tested against known source-of-truth values, typically from existing dashboards or validated datasets maintained by the finance team. We linked each metric to a validation source so anyone could independently verify the output.
- Promote governance level. Once a metric passed validation, we promoted it from preliminary to verified, documenting the validation methodology.
- Test end-to-end. We ran the question through the full stack (natural language → AI agent → Block Data MCP → Metrics Store → Snowflake → response) and compared the output against the ground truth.
By the end of the pilot, we had added 59 priority metrics to the Block Metrics Store for the financial domain and achieved 100% accuracy for questions where the metric was available through Block Data MCP. The Finance Copilot launched with a dedicated space in our internal AI platform, providing finance leadership with governed access to both structured financial metrics (via Block Data MCP) and unstructured IR documents (via a separate document intelligence component built on Glean MCP).
Proving Value: Query Expert MCP
From September 2025 to March 2026, the number of employees using Query Expert increased from 700 to 2.1K per month, representing over 33% of the company. Query Expert disseminates institutional data knowledge to all employees by providing data context, table information, and best query practices at scale. Value comes from generating novel SQL, but also unblocking data discovery, understanding data nuances and finding data domain experts to consult with.
Teams are using Query Expert to ask questions about the data just as much as they ask data questions. This helps technical and non technical users discover, validate and use data more effectively:
"Who can I work with to learn more about commerce data?"
"What is the best table to find Square tip payout amounts to the cash app?"
"Can you validate this query for me using best practices? Select …"
The majority of users are using Query Expert for natural language SQL generation. This has accelerated intermediate to expert SQL writers to go from question to insights.
Measuring Impact
Since launching in Q3 2025, adoption of both tools has grown rapidly across Block:
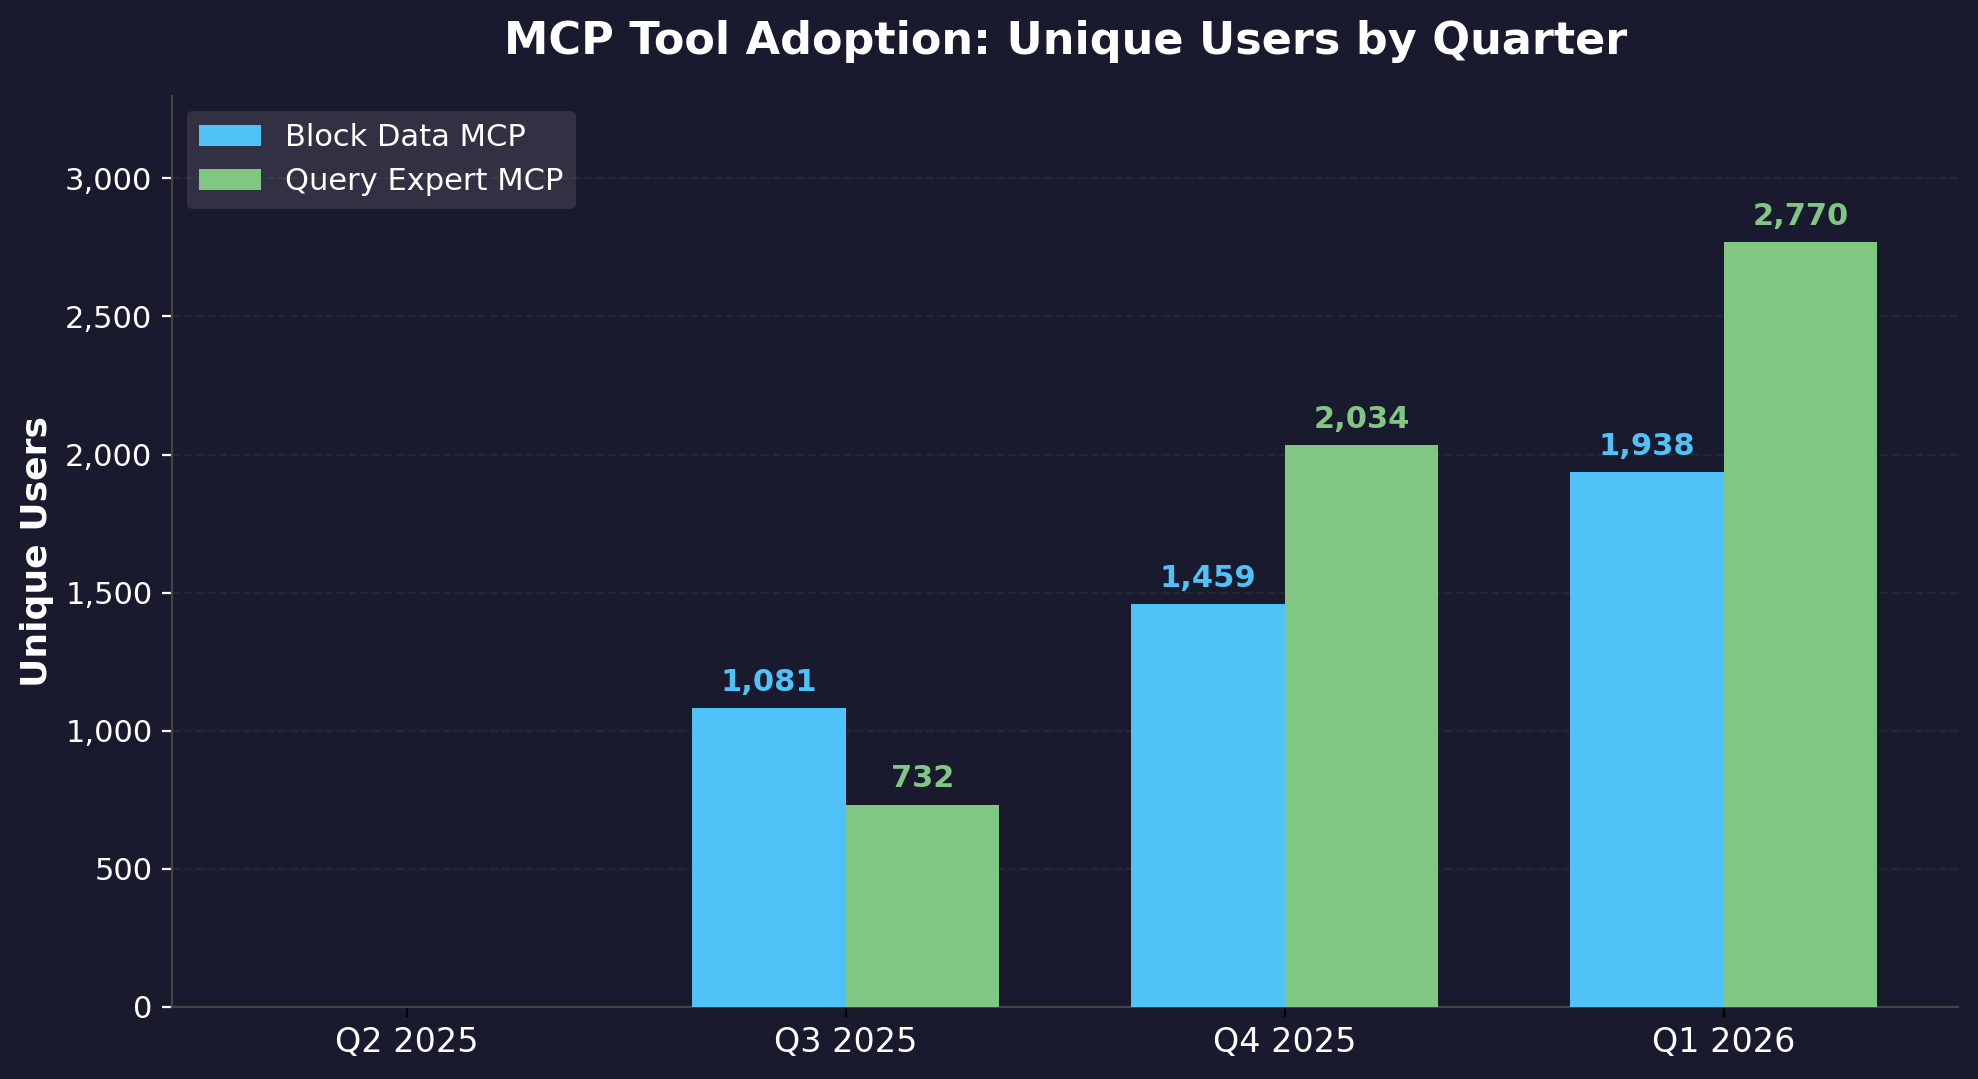
From zero users in Q2 2025 to over 1,800 quarterly unique users for each tool by Q1 2026, the platform saw rapid organic adoption. Block Data MCP reached 1,812 unique users and Query Expert MCP reached 1,899 — together representing broad adoption across business and technical users alike.
As of Q1 2026, data stewards across Block have contributed over 1,100 governed metrics to the Block Metrics Store, spanning all major brands and data domains.
To quantify the efficiency gains, we ran blind experiments comparing how long analysts took to answer questions with and without the MCP tools. The results showed an 87% reduction in analyst time. In the Finance Copilot pilot, answering the 40 key business questions through the traditional analyst workflow took 7.6 hours. With Block Data MCP, the same 40 questions were answered in under 1 hour with 100% accuracy.
Agentic Automations
Another impact story we can share is how the governed data foundation enabled agentic automation. With deterministic SQL and robust CI/CD in our code repositories, we were able to build end-to-end AI automation loops that transforms user feedback into production-ready code. Users submit feedback directly through Block Data MCP and Query Expert MCP. An automated workflow converts that feedback into structured Linear tickets, performs context gathering and research, generates implementation plans, writes the code, and creates pull requests. An engineer simply has to review and merge.
Using this system, we closed a backlog of 40 tickets with only three hours of human effort, an estimated 85% time savings. One ticket previously would take an average of two hours for an engineer to process, but with the agentic automation loop it took roughly five minutes of human effort while the AI Agent worked for 30 minutes.
The key enabler here was not the AI agent itself. It was the governed data foundation underneath. Because metric definitions follow a strict schema, because CI/CD tests validate correctness, and because CODEOWNERS enforce review, the AI agent had clear guardrails to work within. Automation is a byproduct of good data governance, not a replacement for it.
The architecture described in this post was built to solve an analytics problem. But once the foundation was in place, it became a platform that other use cases could build on top of. The data mesh provides consistent domain ownership and governance. The Block Metrics Store provides deterministic, trusted data retrieval. And the MCP interface provides a standard way for AI agents to interact with all of it. Together, they form a reusable substrate for any workflow that needs to go from a question to a trusted answer. Additional automation use cases include generative UI dashboarding, automated ETL organized by data domains, and agentic on-call triaging.
Scaling the Solution
Early data domain pilots proved the model worked for targeted respective audiences. The next challenge was making it repeatable without requiring the core development team to hand-hold every new domain. To do this, we codified everything we learned into a Data Domain AI Playbook, an eight-step guide that any data domain team can follow to onboard their data into the system:
- Initial Setup. Establish a cross-functional team, define success metrics, collect 20-50 real business questions from stakeholders, and categorize by complexity.
- Core Metrics Implementation. Build semantic models and metrics in the Block Metrics Store.
- Document Critical Data. Register data products and add table-level documentation so AI tools can discover and understand the data.
- Promote Useful Queries. Tag key example queries for Query Expert MCP so the system can learn from expert patterns.
- Validation Framework. Create evaluation tests for priority questions. Iterate on metric definitions until you achieve 100% accuracy.
- Stakeholder Testing. Run controlled experiments comparing manual processes against the AI-powered workflow. Measure time savings, accuracy, and completeness.
- Launch. Educate stakeholders on how and when to use Block Data MCP and Query Expert MCP. Consider building a curated domain dashboard.
- Recursive Expansion. Add metrics iteratively based on new priority questions. Maintain the evaluation framework as the metric portfolio grows.
If You're Building Something Similar
The specifics of our stack matter less than the principles that shaped them. Here are some key takeaways:
- Understand your customers and their usage needs. Trying to serve every persona through one interface produced a tool that was unreliable to one audience and constraining to the other. Splitting Block Data MCP and Query Expert MCP along the natural seam between deterministic accuracy and exploratory flexibility was the unlock. Map the user intents you actually have and design separate paths for each.
- Optimize for solving small, targeted problems first. We didn't start by building a general-purpose AI for analytics. We started with 40 questions a CFO asks every quarter. A narrow, opinionated success criterion gave us a finish line we could measure against.
- Centralize standards, distribute ownership. Centralized data teams struggle to scale with a company that has hundreds of thousands of tables and dozens of brands. But pure decentralization fragments definitions and erodes trust. Federated computational governance is what let us go from a handful of pilot domains to a company-wide platform.
- Make the process replicable. Pilots prove the idea, but a playbook scales it. By turning the work into eight repeatable steps, each new domain becomes a content exercise rather than an infrastructure project.
The hardest part of building AI-powered analytics is the data underneath. Get the foundation right and the agentic AI becomes easier to implement.
Acknowledgements
We would like to thank Joanna Qiu for her active role in the original tiger team, Justin Battles for his work on Query Expert, Vijay Varikota for more smoothly integrating our tools with the Snowflake MCP under the hood, Matthew White for his work on integrating our BI tools, Kelsey Perkins and Ragz Rojkhird for their work on our data domain steering committee, Daniel Gole and Will Dumesnil for their work on our MCP evaluation framework, Anusha Gururaj Jamkhandi and Kalvin Chau for working in the guts of our MCP infrastructure internally, Priya Anantharaman for helping to educate teams on and raise the profile of data domains at Block, Jixin Wang, Conny Chen, and Fan Zhang for their work in our core DS working group for Query Expert. None of this work would have been possible without the managers who believed in resourcing the work and gave feedback along the way: we are especially grateful to Jackie Brosamer, Peter Weir, Paul Luong, and Michael Wexler.
Special shoutout to Andrew Kuttig for shipping the very initial, first draft prototype of Block Metrics Store, and to Peter Weir, Dan Gole, Phil Azar, Matt Stringer, and Justin Battles, for ideating and shipping the initial prototype of Query Expert.