
I recently investigated a view hierarchy leak caused by a third-party Android SDK. This blog post methodically walks through the investigation, shows how to automate leak investigations and how to leverage YourKit on top of LeakCanary to find the root cause of the most gnarly memory leaks.
LeakCanary in short
Quick reminder of how LeakCanary works:
- LeakCanary has a runtime component that hooks into objects that have a known lifecycle. When those objects receive a DESTROY lifecycle event, LeakCanary leverages a WeakReference and a ReferenceQueue to confirm they're being garbage collected as expected.
- If any such object is instead retained, i.e. leaking, LeakCanary triggers a heap dump then parses that heap dump to find the shortest strong reference path from GC Roots to the leaking object. That path is called a leak trace and highlights the references preventing an object from being garbage collected.
Technical terms:
- A ReferenceQueue lets you know when an object wrapped in a
WeakReferencehas been garbage collected. - A heap dump is a copy of the Java heap into a file on disk.
- A GC Root is a special reference to an object that the garbage collector always considers "alive", for example objects referenced by static fields or active threads.
Leak Trace
Here's what LeakCanary surfaced:
1┬─── 2│ GC Root: Global variable in native code 3│ 4├─ com.example.sdk.events.LoggerHolder instance 5│ Leaking: UNKNOWN 6│ ↓ LoggerHolder.logger 7│ ~~~~~~ 8├─ com.example.sdk.LoggerImpl instance 9│ Leaking: UNKNOWN 10│ ↓ LoggerImpl.jankStatsController 11│ ~~~~~~~~~~~~~~~~~~~ 12├─ com.example.sdk.events.performance.JankStatsController instance 13│ Leaking: UNKNOWN 14│ ↓ JankStatsController.jankStats 15│ ~~~~~~~~~ 16├─ androidx.metrics.performance.JankStats instance 17│ Leaking: UNKNOWN 18│ ↓ JankStats.implementation 19│ ~~~~~~~~~~~~~~ 20├─ androidx.metrics.performance.JankStatsApi31Impl instance 21│ Leaking: UNKNOWN 22│ ↓ JankStatsApi24Impl.window 23│ ~~~~~~ 24├─ com.android.internal.policy.PhoneWindow instance 25│ Leaking: UNKNOWN 26│ ↓ PhoneWindow.mDecor 27│ ~~~~~~ 28╰→ com.android.internal.policy.DecorView instance 29 Leaking: YES (ObjectWatcher was watching this because com.android.internal.policy.DecorView received View#onDetachedFromWindow() callback) 30 key = 63e37e45-95ed-4cea-a0b8-8e23d4c78635 31 View not part of a window view hierarchy 32 View.mAttachInfo is null (view detached) 33 View.mWindowAttachCount = 1 34 mContext instance of android.view.ContextThemeWrapper, wrapping activity com.squareup.ui.main.MainActivity with mDestroyed = false
This is a chain of objects and references from a GC Root (here a global variable in native code) to a leaking object (here a detached DecorView). Let's look at a single node as an example to break down what we're looking at:
1├─ com.android.internal.policy.PhoneWindow instance
2│    Leaking: UNKNOWN
3│    ↓ PhoneWindow.mDecor
4│                  ~~~~~~
├─ com.android.internal.policy.PhoneWindow instance: the node is an instance of thePhoneWindowclass.│ Leaking: UNKNOWN: LeakCanary could not automatically decide if that object should still be in memory or not.│ ↓ PhoneWindow.mDecor: thePhoneWindowinstance has anmDecorfield that holds a reference to the next object in the trace.
Method
It's really tempting to look at a trace, pick something suspicious and try a semi random fix. Don't do that.
As I covered in Embracing the Chaos: Investigating Production Madness, your job is not to fix issues, your job is to understand root causes. This skill is even more critical in the age of stochastic parrots. Use tools like LLMs to gain a deeper understanding of your systems rather than as replacement for thinking and learning.
I follow the same method for every leak: identifying the single bad reference in a leak trace by systematically determining which objects are expected to still be in memory vs not. Here's what you should know:
- At the bottom of the leak trace, you'll find the object that reached a DESTROY lifecycle event and triggered leakcanary. That object is not the "leak".
- A leak is a single bad reference somewhere in the leaktrace.
- A bad reference means a reference that should have been cleared and wasn't, causing a bunch of other objects to remain in memory longer than they should
- The leaktrace is a chain of objects linked by references. Every object typically has an expected retain state: either it should be in memory or it shouldn't.
In theory, a leaktrace can be split in two parts:
- the top, objects that should be in memory,
- the bottom, objects that shouldn't.
The leak is the single reference that connects top to bottom. Our job is to find that bad reference in the leak trace.
1┬─── 2│ GC Root 3│ 4├─ com.example.A instance 5│ Leaking: NO 6│ ↓ A.fieldB 7├─ com.example.B instance 8│ Leaking: NO 9│ ↓ B.fieldC 10│ ~~~~~~ 11├─ com.example.C instance 12│ Leaking: YES 13│ ↓ C.fieldD 14├─ com.example.D instance 15│ Leaking: YES 16│ ↓ D.fieldE 17╰→ com.example.E instance 18 Leaking: YES
In this example leak trace, the top (objects that should be in memory) is:
1┬─── 2│ GC Root 3│ 4├─ com.example.A instance 5│ Leaking: NO 6│ ↓ A.fieldB 7├─ com.example.B instance 8│ Leaking: NO 9│ ↓ B.fieldC
and the bottom (objects that shouldn't be in memory) is:
1├─ com.example.C instance 2│ Leaking: YES 3│ ↓ C.fieldD 4├─ com.example.D instance 5│ Leaking: YES 6│ ↓ D.fieldE 7╰→ com.example.E instance 8 Leaking: YES
The leak is the single reference that connects top to bottom, and LeakCanary higlights it as such with ~~~~~~:
1┬─── 2│ GC Root 3│ 4├─ com.example.A instance 5│ Leaking: NO 6│ ↓ A.fieldB 7├─ com.example.B instance 8│ Leaking: NO 9 10│ ↓ B.fieldC 11│ ~~~~~~ 12 13├─ com.example.C instance 14│ Leaking: YES 15│ ↓ C.fieldD 16├─ com.example.D instance 17│ Leaking: YES 18│ ↓ D.fieldE 19╰→ com.example.E instance 20 Leaking: YES
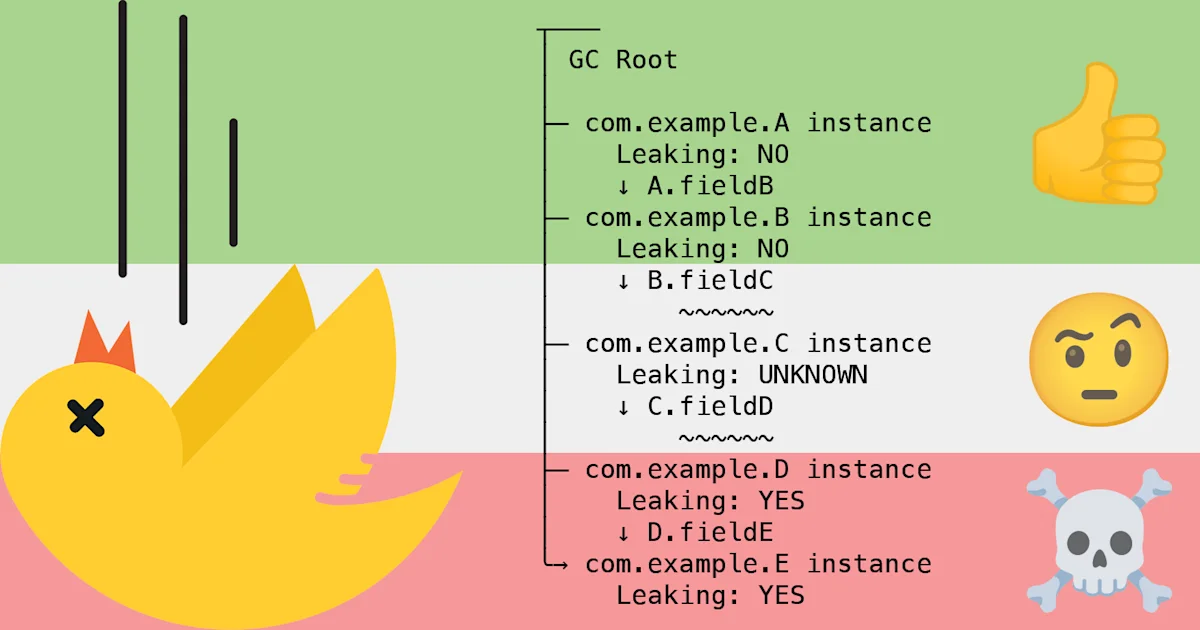
In practice we often don't know whether objects on the trace should be in memory or not, but we know:
- If a given object should be in memory, then all objects above it should also be in memory.
- If a given object should not be in memory, then all objects below it should also not be in memory.
This leads to traces being split in 3 parts from top to bottom: the not leaking objects, the unknown objects, the leaking objects.
In our previous example, if we change the C instance to Leaking: UNKNOWN, we now have two references that are suspect of being the bad reference.
1┬─── 2│ GC Root 3│ 4├─ com.example.A instance 5│ Leaking: NO 6│ ↓ A.fieldB 7├─ com.example.B instance 8│ Leaking: NO 9│ ↓ B.fieldC 10│ ~~~~~~ 11├─ com.example.C instance 12│ Leaking: UNKNOWN 13│ ↓ C.fieldD 14│ ~~~~~~ 15├─ com.example.D instance 16│ Leaking: YES 17│ ↓ D.fieldE 18╰→ com.example.E instance 19 Leaking: YES
If we can figure out, amongst the unknown objects, which ones are leaking vs not, then we'll know where the leak is as it'll be the single reference connecting the non leaking objects to the leaking objects.
Leveraging what we know
Let’s apply this method step-by-step, starting with the top of the leak trace:
1┬───
2│ GC Root: Global variable in native code
3│
4├─ com.example.sdk.events.LoggerHolder instance
5│    Leaking: UNKNOWN
6│    ↓ LoggerHolder.logger
7│                   ~~~~~~
8├─ com.example.sdk.LoggerImpl instance
9│    Leaking: UNKNOWN
10│    ↓ LoggerImpl.jankStatsController
11│                 ~~~~~~~~~~~~~~~~~~~
12├─ com.example.sdk.events.performance.JankStatsController instance
13│    Leaking: UNKNOWN
- Looking at the SDK sources, we see that
LoggerImplis a singleton, it stays in memory all the time. So we know that it's not leaking, and we can change its state fromLeaking: UNKNOWNtoLeaking: NO. - Since
LoggerImplis not leaking, any object above it in the leaktrace is definitely not causing the leak, so we can update the state ofLoggerHoldertoLeaking: NO. - The
~~~~~~highlight references that could be bad references, i.e. references connecting the "not leaking" group to the "leaking" group. Now that we know thatLoggerImplis not leaking, the reference fromLoggerHolder.loggertoLoggerImplis not suspect anymore, and we can remove the~~~~~~.
Here's the updated trace:
1┬───
2│ GC Root: Global variable in native code
3│
4├─ com.example.sdk.events.LoggerHolder instance
5│    Leaking: NO
6│    ↓ LoggerHolder.logger
7├─ com.example.sdk.LoggerImpl instance
8│    Leaking: NO
9│    ↓ LoggerImpl.jankStatsController
10│                 ~~~~~~~~~~~~~~~~~~~
11├─ com.example.sdk.events.performance.JankStatsController instance
12│    Leaking: UNKNOWN
From the source code, we see that JankStatsController is created in the LoggerImpl constructor and assigned to a final field. So JankStatsController is also meant to be a singleton, JankStatsController is not leaking, and LoggerImpl.jankStatsController is not a bad reference.
Here's the updated trace:
1┬─── 2│ GC Root: Global variable in native code 3│ 4├─ com.example.sdk.events.LoggerHolder instance 5│ Leaking: NO 6│ ↓ LoggerHolder.logger 7├─ com.example.sdk.LoggerImpl instance 8│ Leaking: NO 9│ ↓ LoggerImpl.jankStatsController 10├─ com.example.sdk.events.performance.JankStatsController instance 11│ Leaking: NO 12│ ↓ JankStatsController.jankStats 13│ ~~~~~~~~~ 14├─ androidx.metrics.performance.JankStats instance 15│ Leaking: UNKNOWN 16│ ↓ JankStats.implementation 17│ ~~~~~~~~~~~~~~ 18├─ androidx.metrics.performance.JankStatsApi31Impl instance 19│ Leaking: UNKNOWN 20│ ↓ JankStatsApi24Impl.window 21│ ~~~~~~ 22├─ com.android.internal.policy.PhoneWindow instance 23│ Leaking: UNKNOWN 24│ ↓ PhoneWindow.mDecor 25│ ~~~~~~ 26╰→ com.android.internal.policy.DecorView instance 27 Leaking: YES (ObjectWatcher was watching this because com.android.internal.policy.DecorView received View#onDetachedFromWindow() callback) 28 key = 63e37e45-95ed-4cea-a0b8-8e23d4c78635 29 View not part of a window view hierarchy 30 View.mAttachInfo is null (view detached) 31 View.mWindowAttachCount = 1 32 mContext instance of android.view.ContextThemeWrapper, wrapping activity com.squareup.ui.main.MainActivity with mDestroyed = false
Lifecycle of PhoneWindow & DecorView
We know that the DecorView received the View#onDetachedFromWindow() callback, and LeakCanary has determined that it is leaking. Given that PhoneWindow has an mDecor field that references the leaking DecorView, we can conclude that this is the DecorView associated with the PhoneWindow (those typically go in pair), and therefore that:
- the
PhoneWindowhas the same lifecycle as theDecorViewand is leaking as well, - the
mDecorreference fromPhoneWindowtoDecorViewis not a bad reference.
Here's the updated trace:
1┬─── 2│ GC Root: Global variable in native code 3│ 4├─ com.example.sdk.events.LoggerHolder instance 5│ Leaking: NO 6│ ↓ LoggerHolder.logger 7├─ com.example.sdk.LoggerImpl instance 8│ Leaking: NO 9│ ↓ LoggerImpl.jankStatsController 10├─ com.example.sdk.events.performance.JankStatsController instance 11│ Leaking: NO 12│ ↓ JankStatsController.jankStats 13│ ~~~~~~~~~ 14├─ androidx.metrics.performance.JankStats instance 15│ Leaking: UNKNOWN 16│ ↓ JankStats.implementation 17│ ~~~~~~~~~~~~~~ 18├─ androidx.metrics.performance.JankStatsApi31Impl instance 19│ Leaking: UNKNOWN 20│ ↓ JankStatsApi24Impl.window 21│ ~~~~~~ 22├─ com.android.internal.policy.PhoneWindow instance 23│ Leaking: YES 24│ ↓ PhoneWindow.mDecor 25╰→ com.android.internal.policy.DecorView instance 26 Leaking: YES (ObjectWatcher was watching this because com.android.internal.policy.DecorView received View#onDetachedFromWindow() callback) 27 key = 63e37e45-95ed-4cea-a0b8-8e23d4c78635 28 View not part of a window view hierarchy 29 View.mAttachInfo is null (view detached) 30 View.mWindowAttachCount = 1 31 mContext instance of android.view.ContextThemeWrapper, wrapping activity com.squareup.ui.main.MainActivity with mDestroyed = false
Lifecycle of JankStats
We're left with two objects in UNKNOWN state: JankStats and JankStatsApi31Impl
The JankStat sources show that JankStatsApi31Impl is created and assigned to a final field in JankStats's constructor. This tells us that JankStatsApi31Impl and JankStats have the same lifecycle and the same leaking / not leaking state.
The sources also show that the JankStat instance is created with a window passed in, and that window is passed to the JankStatsApi31Impl constructor, which stores it in a field. The leaktrace shows that this window field references the leaking window.
From that, we can conclude that JankState and JankStatsApi31Impl have the same expected lifecycle of that of the window they own, and so they're both leaking.
Here's the updated trace:
1┬─── 2│ GC Root: Global variable in native code 3│ 4├─ com.example.sdk.events.LoggerHolder instance 5│ Leaking: NO 6│ ↓ LoggerHolder.logger 7├─ com.example.sdk.LoggerImpl instance 8│ Leaking: NO 9│ ↓ LoggerImpl.jankStatsController 10├─ com.example.sdk.events.performance.JankStatsController instance 11│ Leaking: NO 12│ ↓ JankStatsController.jankStats 13│ ~~~~~~~~~ 14├─ androidx.metrics.performance.JankStats instance 15│ Leaking: YES 16│ ↓ JankStats.implementation 17├─ androidx.metrics.performance.JankStatsApi31Impl instance 18│ Leaking: YES 19│ ↓ JankStatsApi24Impl.window 20├─ com.android.internal.policy.PhoneWindow instance 21│ Leaking: YES 22│ ↓ PhoneWindow.mDecor 23╰→ com.android.internal.policy.DecorView instance 24 Leaking: YES (ObjectWatcher was watching this because com.android.internal.policy.DecorView received View#onDetachedFromWindow() callback) 25 key = 63e37e45-95ed-4cea-a0b8-8e23d4c78635 26 View not part of a window view hierarchy 27 View.mAttachInfo is null (view detached) 28 View.mWindowAttachCount = 1 29 mContext instance of android.view.ContextThemeWrapper, wrapping activity com.squareup.ui.main.MainActivity with mDestroyed = false
Only one suspect reference remains: JankStatsController.jankStats. Earlier, I wrote:
If we can figure out, amongst the unknown objects, which ones are leaking vs not, then we'll know where the leak is, as it'll be the single reference connecting the non leaking objects to the leaking objects.
We now know that the leak is that JankStatsController.jankStats wasn't cleared when the window associated to JankStat was detached.
Automating what we know
This approach to identifying the bad reference is very algorithmic. Let's encode our reasoning so LeakCanary can reach the same conclusion automatically next time.
Knowledge 1: JankStatsController is a singleton
We can teach LeakCanary to always recognize any JankStatsController instance as a singleton that is never leaking, by providing a custom ObjectInspector:
kotlin1// ObjectInspector is called for every object found in a leak trace.
2val controllerInspector = ObjectInspector { reporter ->
3  // Mark every JankStatsController as not leaking, with a label explaining
4  // that it's a singleton.
5  reporter.whenInstanceOf("com.example.sdk.events.performance.JankStatsController") {
6    notLeakingReasons += "JankStatsController is an app singleton"
7  }
8}
9
10// Update the default LeakCanary config to add our custom ObjectInspector.
11LeakCanary.config = LeakCanary.config.run {
12  copy(
13    objectInspectors = objectInspectors +
14    controllerInspector
15  )
16}
In Square POS I added an ObjectInspector that marks all Dagger singletons as either leaking or not leaking depending on the status of the scope of their Dagger component. This is beyond the scope of this article, let me know if you're interested in finding out more!
Knowledge 2: JankStats is tied to its window's decor view
Let's look at the chain of references at the bottom of the leak trace:
1├─ androidx.metrics.performance.JankStats instance
2│    ↓ JankStats.implementation
3├─ androidx.metrics.performance.JankStatsApi31Impl instance
4│    ↓ JankStatsApi24Impl.window
5├─ com.android.internal.policy.PhoneWindow instance
6│    ↓ PhoneWindow.mDecor
7╰→ com.android.internal.policy.DecorView instance
We know that the lifecycle of JankStats is the same as the lifecycle of the DecorView that it indirectly retains through JankStats.implementation.window.mDecor. From a JankStats instance, we can find the associated DecorView then check if that DecorView is detached by checking if DecorView.mAttachInfo is null.
This is a bit more involved, I wrote two utility functions to remove boilerplate, but hopefully you get the idea:
kotlin1fun HeapObject.HeapInstance.getFieldValue(fieldName: String): HeapValue? {
2  return readFields().firstOrNull { field -> field.name == fieldName }?.value
3}
4
5infix fun HeapValue.valueAsInstanceOf(className: String): HeapObject.HeapInstance? {
6  return asObject?.asInstance?.let { instance ->
7    if (instance.instanceClass.classHierarchy.any { it.name == className }) {
8      instance
9    } else {
10      null
11    }
12  }
13}
14
15val jankStatsInspector = ObjectInspector { reporter ->
16  reporter.whenInstanceOf("androidx.metrics.performance.JankStats") {
17    it.getFieldValue("implementation")
18      ?.valueAsInstanceOf("androidx.metrics.performance.JankStatsApi24Impl")
19      ?.getFieldValue("window")
20      ?.valueAsInstanceOf("com.android.internal.policy.PhoneWindow")
21      ?.getFieldValue("mDecor")
22      ?.valueAsInstanceOf("com.android.internal.policy.DecorView")
23      ?.getFieldValue("mAttachInfo")
24      ?.isNullReference
25      ?.let { isJankStatsRetainingDetachedDecorView ->
26        if (isJankStatsRetainingDetachedDecorView) {
27          reporter.leakingReasons += "JankStats is retaining a detached DecorView"
28        } else {
29          reporter.notLeakingReasons += "JankStats is retaining an attached DecorView"
30        }
31      }
32  }
33}
34
35val controllerInspector = ...
36
37LeakCanary.config = LeakCanary.config.run {
38  copy(
39    objectInspectors = objectInspectors +
40      controllerInspector +
41      jankStatsInspector
42  )
43}
Final trace
This is what the trace now looks like with our new shiny object inspectors.
1┬─── 2│ GC Root: Global variable in native code 3│ 4├─ com.example.sdk.events.LoggerHolder instance 5│ Leaking: NO (JankStatsController↓ is not leaking) 6│ ↓ LoggerHolder.logger 7├─ com.example.sdk.LoggerImpl instance 8│ Leaking: NO (JankStatsController↓ is not leaking) 9│ ↓ LoggerImpl.jankStatsController 10├─ com.example.sdk.events.performance.JankStatsController instance 11│ Leaking: NO (JankStatsController is an app singleton) 12│ ↓ JankStatsController.jankStats 13│ ~~~~~~~~~ 14├─ androidx.metrics.performance.JankStats instance 15│ Leaking: YES (JankStats is retaining a detached DecorView) 16│ ↓ JankStats.implementation 17├─ androidx.metrics.performance.JankStatsApi31Impl instance 18│ Leaking: YES (JankStats↑ is leaking) 19│ ↓ JankStatsApi24Impl.window 20├─ com.android.internal.policy.PhoneWindow instance 21│ Leaking: YES (JankStats↑ is leaking) 22│ ↓ PhoneWindow.mDecor 23╰→ com.android.internal.policy.DecorView instance 24 Leaking: YES (ObjectWatcher was watching this because com.android.internal.policy.DecorView received View#onDetachedFromWindow() callback) 25 key = 63e37e45-95ed-4cea-a0b8-8e23d4c78635 26 View not part of a window view hierarchy 27 View.mAttachInfo is null (view detached) 28 View.mWindowAttachCount = 1 29 mContext instance of android.view.ContextThemeWrapper, wrapping activity com.squareup.ui.main.MainActivity with mDestroyed = false
As you can see, LeakCanary now surfaces a single suspect reference, we've turned our knowledge into code!
Notice how LoggerImpl is reported as Leaking: NO with the reason JankStatsController↓ is not leaking, and similarly PhoneWindow is reported as Leaking: YES with the reason JankStats↑ is leaking. This is the result of LeakCanary automatically applying the rules we shared earlier:
- If a given object should be in memory, then all objects above it should also be in memory.
- If a given object should not be in memory, then all objects below it should also not be in memory.
JankStatsController
We know where the problem is, but we still don't know how this happened, we don't have a root cause. Let's look into JankStatsController.
The JankStat library tracks frame durations in production apps. Originally, the third-party SDK code leveraging JankStats looked like this:
kotlin1class JankStatsController(
2  private val application: Application,
3) : Application.ActivityLifecycleCallbacks {
4
5  private var jankStats: JankStats? = null
6
7  fun start() {
8    application.registerActivityLifecycleCallbacks(this)
9  }
10
11  override fun onActivityResumed(activity: Activity) {
12    createJankStat(activity.window)
13  }
14
15  private fun createJankStat(window: Window) {
16    jankStats = JankStats.createAndTrack(window) {
17      // Handling frame data here
18    }
19  }
20
21  override fun onActivityPaused(activity: Activity) {
22    jankStats?.isTrackingEnabled = false
23    jankStats = null
24  }
25}
Simple enough: track frame durations whenever an activity is started, stop when an activity is paused. Unfortunately, if the SDK was started after an activity was already created, JankStat wouldn't be active for that activity. The SDK worked around that by updating JankStatsController.start() to use WindowInspector.getGlobalWindowViews() and View.phoneWindow from Curtains:
kotlin1  fun start() {
2    val currentWindow = WindowInspector.getGlobalWindowViews()
3      .firstOrNull()?
4      .phoneWindow
5    if (currentWindow != null) {
6      createJankStat(currentWindow)
7    }
8
9    application.registerActivityLifecycleCallbacks(this)
10  }
11}
This seems fairly reasonable as we expect JankStats to be stopped whenever the activity gets paused. However, remember that the bottom of our leak trace looks like this:
1├─ com.android.internal.policy.PhoneWindow instance 2│ Leaking: YES (JankStats↑ is leaking) 3│ ↓ PhoneWindow.mDecor 4╰→ com.android.internal.policy.DecorView instance 5 Leaking: YES (ObjectWatcher was watching this because com.android.internal.policy.DecorView received View#onDetachedFromWindow() callback) 6 key = 63e37e45-95ed-4cea-a0b8-8e23d4c78635 7 View not part of a window view hierarchy 8 View.mAttachInfo is null (view detached) 9 View.mWindowAttachCount = 1 10 mContext instance of android.view.ContextThemeWrapper, wrapping activity 11com.squareup.ui.main.MainActivity with mDestroyed = false
The decor view was detached, but its context is an activity that is not destroyed. How can that happen?
YourKit Java Profiler
When a leak is detected in a Square POS debug build, we upload the leak traces but also upload the heap dump to Amazon S3. This comes in handy when the leak traces aren't enough and we need to investigate further by opening the heap dump in YourKit.
YourKit Java Profiler provides a UI for navigating java heap dumps. It's similar in spirit to Android Studio's "Analyze memory usage" UI but offers better object graph exploration. If your company cares about investigating the memory usage of your Android apps, they should at least buy a couple floating licenses.
The first step is to locate the leaking instance in YourKit through KeyedWeakReference instances.
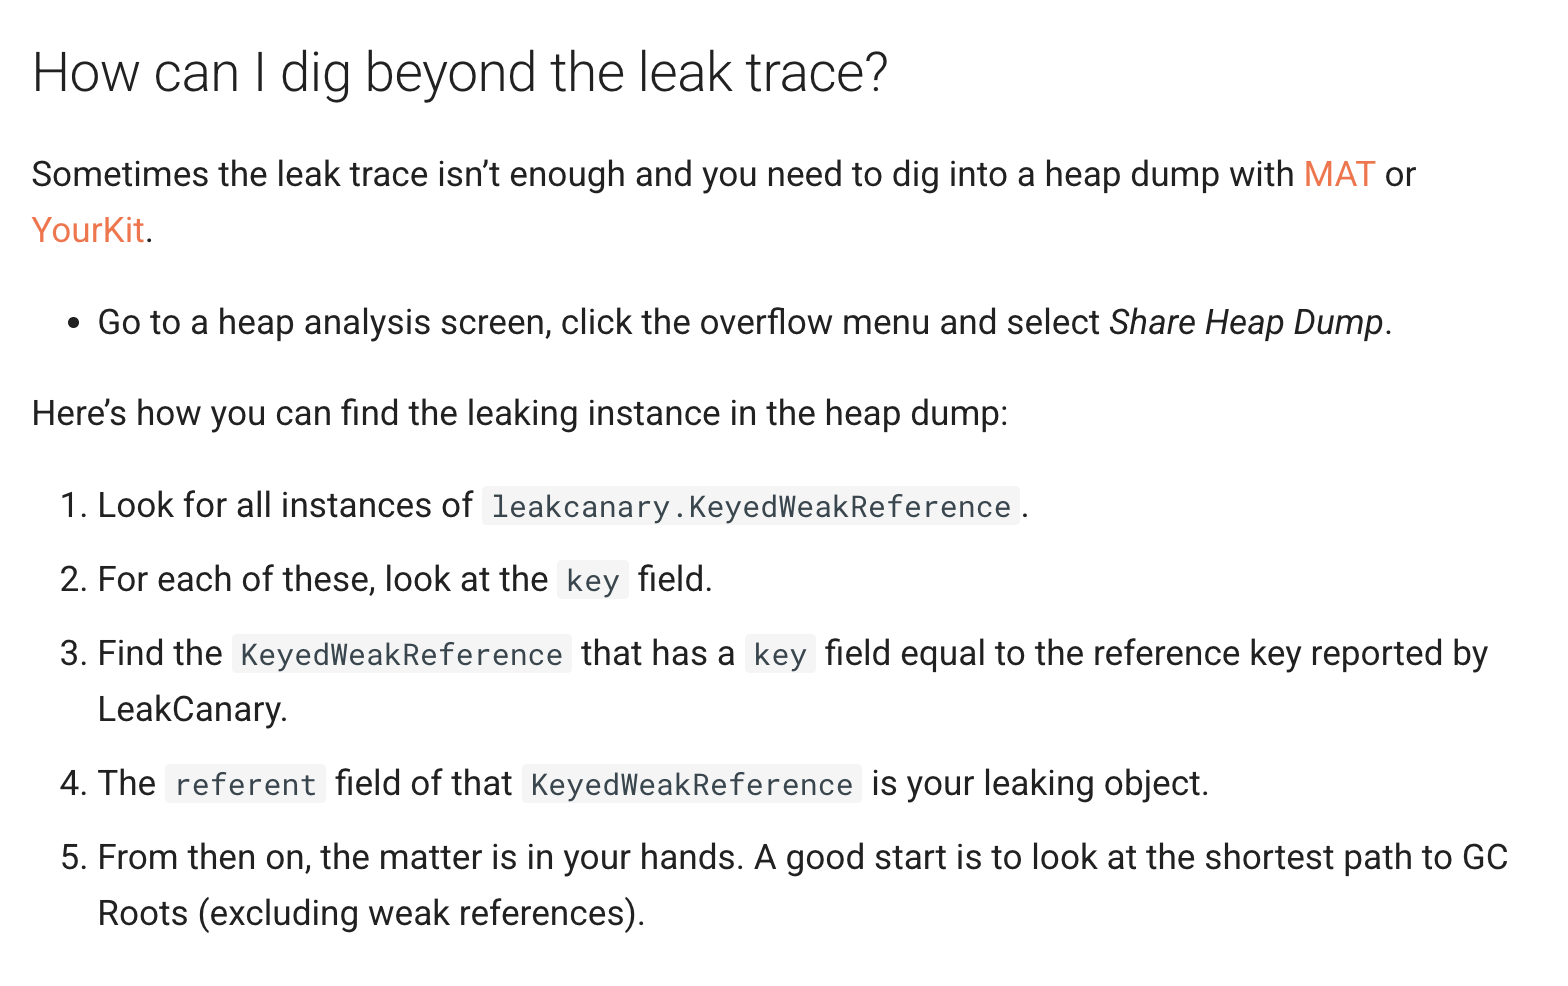
Make sure the leaking instance key matches KeyedWeakReference.key:
1╰→ com.android.internal.policy.DecorView instance 2 Leaking: YES (ObjectWatcher was watching this because com.android.internal.policy.DecorView received View#onDetachedFromWindow() callback) 3 key = 63e37e45-95ed-4cea-a0b8-8e23d4c78635
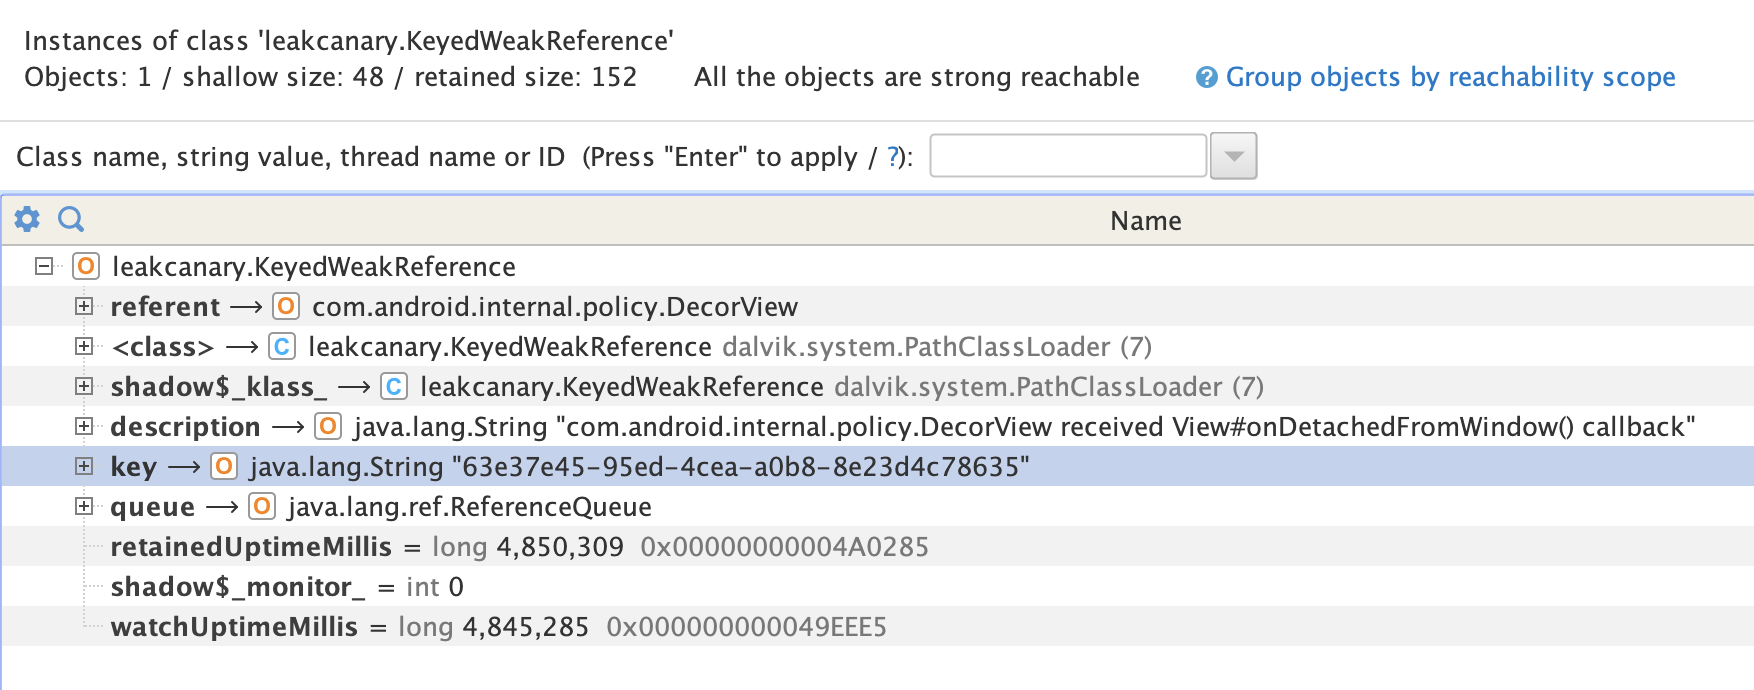
Navigating the object graph, I realize that the window of the leaking DecorView is not the same instance as the window of the Activity that was used as context to create the DecorView.
This means the leaking window is not an activity window.
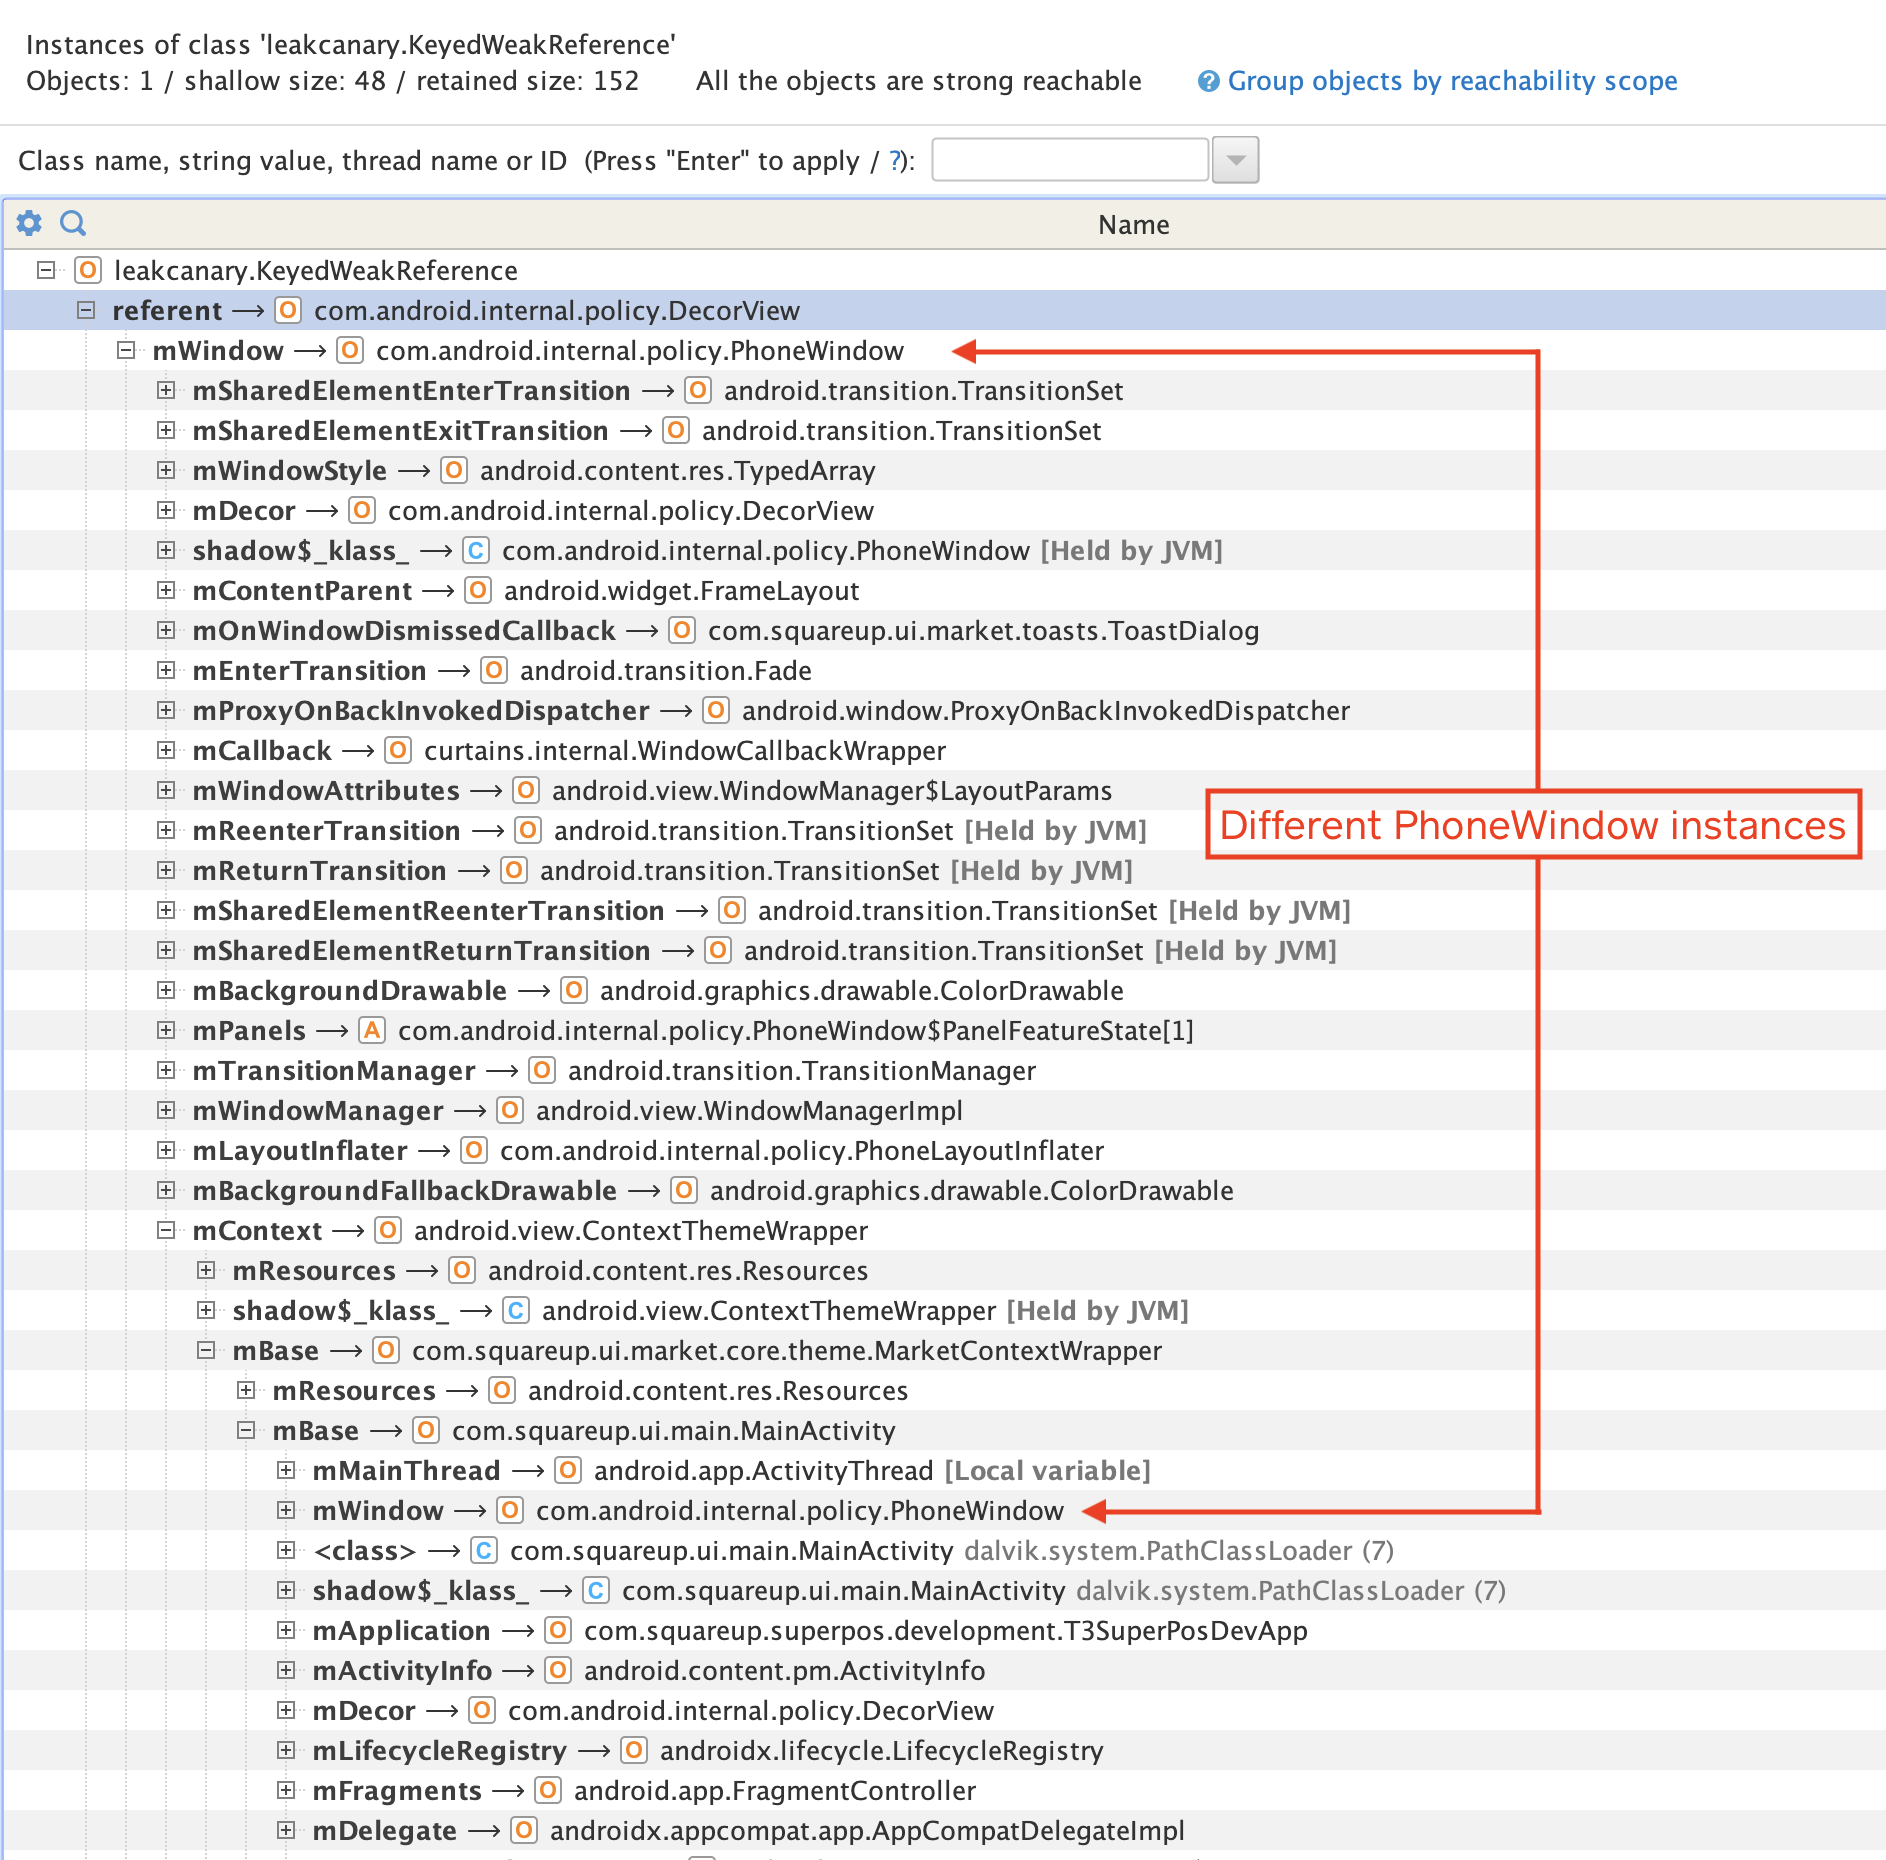
So I look up which objects have incoming references to the leaking window:
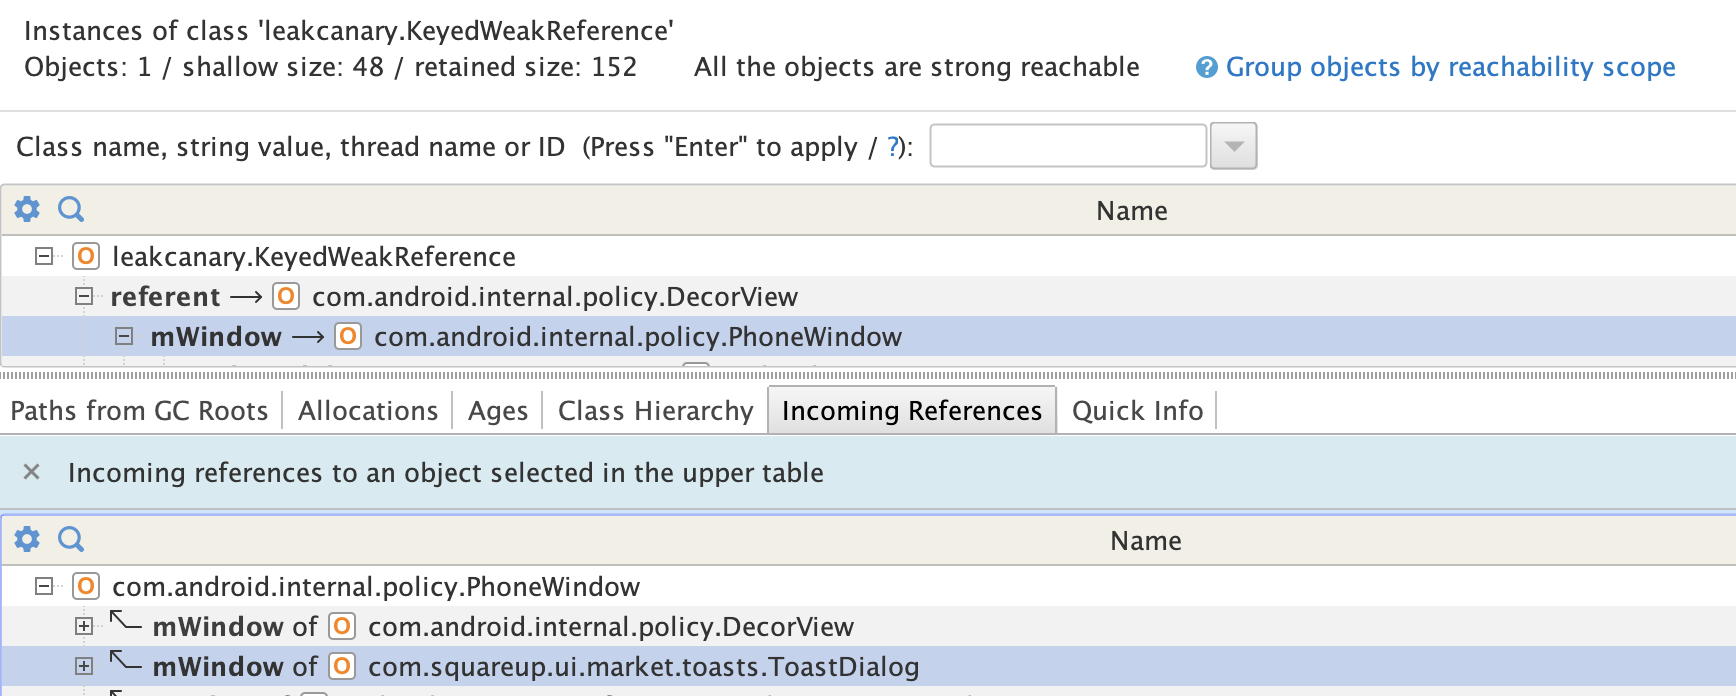
Ah, interesting, that leaking window is the window of a custom Square class, ToastDialog, which apparently displays some kind of "toast" using the Dialog API instead of the Toast API. No idea why we did that, but we now have our smoking gun. Remember how JankStatsController creates the JankStats instance:
kotlin1  fun start() {
2    val currentWindow = WindowInspector.getGlobalWindowViews()
3      .firstOrNull()?
4      .phoneWindow
5    if (currentWindow != null) {
6      createJankStat(currentWindow)
7    }
8
9    application.registerActivityLifecycleCallbacks(this)
10  }
11
12  override fun onActivityPaused(activity: Activity) {
13    jankStats?.isTrackingEnabled = false
14    jankStats = null
15  }
16}
It's now clear that currentWindow was pointing to a dialog window here instead of an activity window. The dialog was dismissed but the activity stayed resumed, so onActivityPaused() wasn't called and the dialog window was retained longer than needed by the JankStat instance.
A single Dialog instance can be shown and dismissed several times, and consequently its view hierarchy can be attached / detached several time, so by default LeakCanary does not attempt to detect leak detection of dialogs. However, in the Square POS app, we have a rule that dialogs should be created only when needed, and used only once, so we enable LeakCanary's dialog leak detection:
xml1<?xml version="1.0" encoding="utf-8"?>
2<resources>
3  <bool name="leak_canary_watcher_watch_dismissed_dialogs">true</bool>
4</resources>
Reproducing
How can you end up in a situation where there's a resumed activity and yet the first root view is that of a dialog?
I played around with a sample app and managed to reproduce the leak:
kotlin1class MainActivity : AppCompatActivity() {
2
3  override fun onCreate(savedInstanceState: Bundle?) {
4    super.onCreate(savedInstanceState)
5
6    setContentView(FrameLayout(this))
7
8    // No window views so far.
9    check(WindowInspector.getGlobalWindowViews().isEmpty())
10
11    AlertDialog.Builder(this)
12      .setTitle("This dialog is actually the first window")
13      .setPositiveButton("Click here to trigger leak in 5 seconds", null)
14      .show()
15
16    // Now there is 1 window view, the dialog's window view.
17    check(WindowInspector.getGlobalWindowViews().size == 1)
18
19	// The 2nd window view (the activity window view) will be added
20    // after onCreate()
21    // If we start JankStatsController after here, we'll accidentally set up
22    // JankStats with the dialog window instead of the activity window.
23  }
24}
It turns out that the activity window view gets attached right after Activity.onResume(), so if we show a dialog during Activity.onCreate() that dialog's window view will be first in the list returned by WindowInspector.getGlobalWindowViews().
The core flaw in the third-party SDK code was assuming that there would be at most one window view attached at any given time, and that the window would be an activity window. A proper fix would be to stop making assumptions about windows and activity, and start tracking jank across all windows. Android added an API to be notified of new windows in API version 36.1, there is no backport yet but the Curtains library provides a workaround:
kotlin1Curtains.onRootViewsChangedListeners += OnRootViewAddedListener { view ->
2  view.phoneWindow?.let { phoneWindow ->
3    createJankStat(phoneWindow)
4  }
5}
Conclusion
I hope you enjoyed this deep dive! Here are a few important takeaways:
- During an investigation, your job is not to fix issues, it is to understand root causes.
- Don’t assume that all windows are activity windows: dialogs, toasts, and various overlays can contribute views to
WindowInspector.getGlobalWindowViews(). - Identify the single bad reference in a leak trace by systematically determining which objects are expected to still be in memory vs not.
- You can automate leak investigations by leveraging the
ObjectInspectorAPI. - When the leak trace isn't enough, open the heap dumps with YourKit Java Profiler.